

Super Bowl advertising playbook
A look at the past decade of spend during the Big Game
While the team that wins the Super Bowl may change each year, the network hosting the game will always be the victor. Despite some slippage in ratings and some larger declines in football fandom, Super Bowl ad rates and revenues continue to beat every other event on the TV calendar. 2019 was no exception, with Super Bowl LIII achieving $336 million in in-game revenue. Kantar’s analysis of the event shows that despite some recent fluctuations, the Super Bowl remains the pre-eminent advertising showcase, and is attracting new digital advertisers in addition to established beverage and automotive brands.
Price of advertising shows modest growth
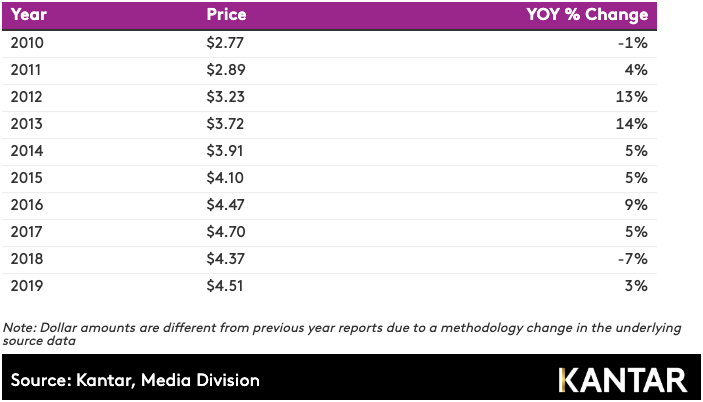
The average price of a 30-second commercial in last year’s Super Bowl increased by 3% to $4.51 million. It’s the second-highest rate ever charged for the games and the costliest advertising time on television by far. The next-most expensive properties in 2019 were the Academy Awards, at $1.95 million, and the AFC Championship Game, at $1.92 million.
The small gain in Super Bowl pricing contrasts with an 11% decrease in the average cost of a 30-second spot in NFL games during the September-December 2018 season, a valuation influenced by prior-year audience losses and concerns that these losses would continue. While Super Bowl viewership has also been declining, it still remains one of the most-watched live events of the year – and Super Bowl ads have developed their own following, continuing to make the game a powerful draw for brands. With ads for the upcoming Super Bowl LIV selling out early for the first time in five years, it’s clear this enthusiasm remains.
Average Price of a 30 Second Super Bowl Commercial (in millions)
More than $400 million of ad revenue
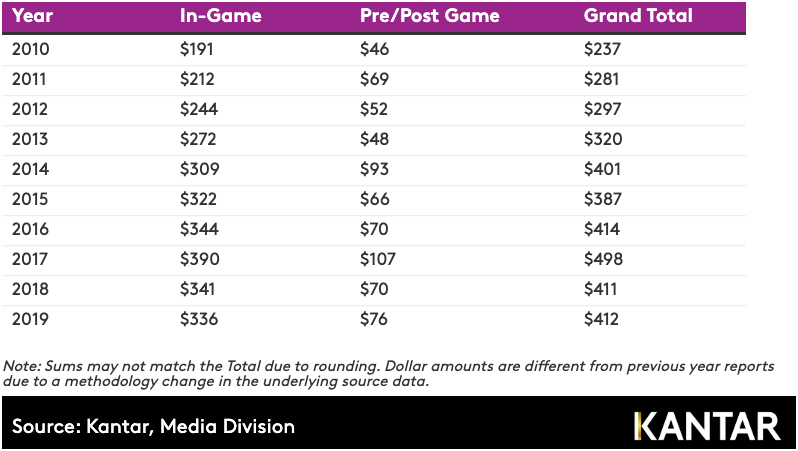
Rising Super Bowl ad prices have generated enormous ad revenue figures. In 2019, marketers spent $336 million for in-game messages. When pre-and post-game programming is included, the total investment rises to $412 million, an amount comparable to the 2018 telecast. If the Super Bowl were a pop-up network operating just one day a year, its ad revenue would rank in the top 40 of all TV networks based on the latter’s full-year performance.
The 2017 Super Bowl still holds the records for in-game ad spending ($390 million) and total ad spending ($498 million); this is due to extra commercial airings in an overtime period as well as an all-time high in ad rates.
Super Bowl Ad Revenue (in millions)
Commercial time remains high
A contributory factor to ad revenue growth has been an increase in the amount of commercial time. The past seven Super Bowl games have been the most ad-saturated in the event’s history. The 2019 game had 49 minutes, 31 seconds of ad messages between the opening kick-off and the final whistle, which was about two minutes less than prior year. The host network adds to the clutter by airing promotional spots for its own shows. These typically account for 15-20% of total ad time and 25-30% of all spots in the game.
Network TV Commercial Time in the Super Bowl Game
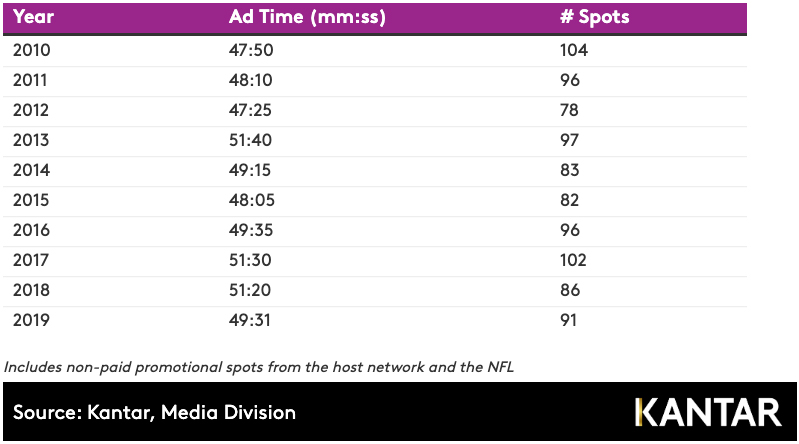
Regular season NFL games contain about 15% less commercial time than the Super Bowl, a difference of about seven minutes per game. Over the past decade, the total ad load for a regular season game has remained relatively flat, while the Super Bowl has got heavier. As NFL games have become longer, in part due to replay challenges, networks have taken steps to trim telecast length by relocating some commercials into the game itself and showing them in a split-screen during pauses in the action. But these are still commercial messages and contribute to the total ad time.
15 second commercials are making inroads
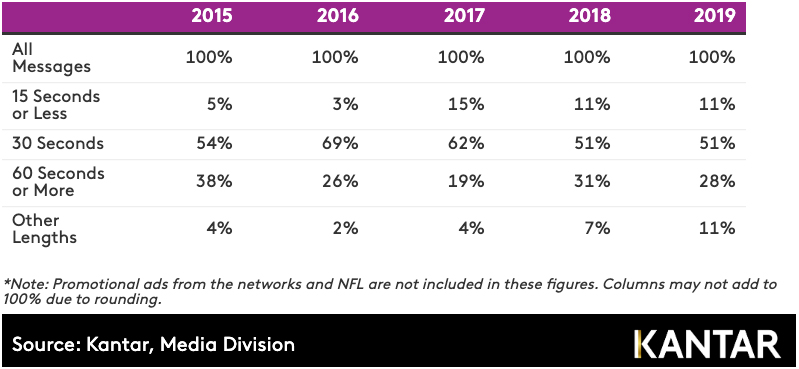
Since 1995, an outright majority of paid messages in every Super Bowl have been 30 seconds long. However, time is money and given rising costs in recent years more advertisers have been running :15s instead of :30s.
In each of the past three games, 10-15% of paid units were :15s in length as compared to an average of 3% from 2011-2016. The proportion of messages that are 30 seconds long has slipped to around 50%. At the other end of the spectrum, a steady 20-30% of in-game spots are one minute in length.
Length of Ad Messages in the Super Bowl*
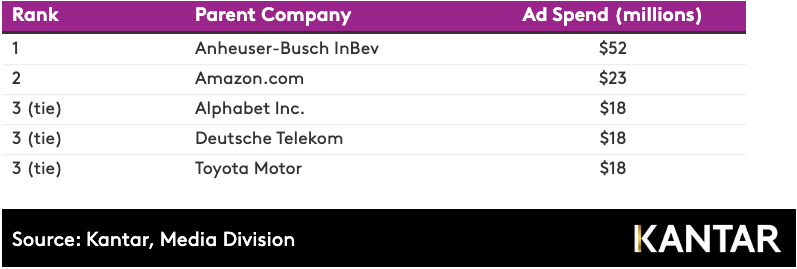
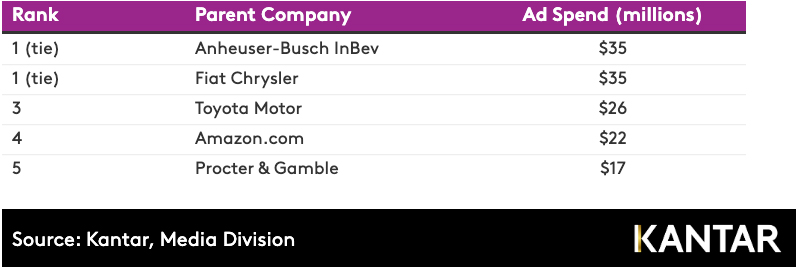
Anheuser stays on top; Amazon and Toyota remain in top five
The largest advertising positions in the Super Bowl tend to be held by well-known marketers. In a typical year, the top five spenders account for about 30%of total ad revenue even as the makeup of the group changes.
Anheuser-Busch In Bev was the largest advertiser in 2019, spending $52 million to support four of its beverage brands. It’s a familiar position for A-B InBev, which has placed in the top two of the annual rankings for at least 38 consecutive years. The company has a long-term relationship with the NFL and its Bud Light beer will be the official beer of the NFL through 2022. The company purchased five minutes, 45 seconds of ad time during the 2019 game, its largest Super Bowl buy in more than 25 years.
Amazon.com claimed the runner-up position with an outlay of $23 million, its second consecutive year in the top five. The e-commerce giant only started advertising during the Super Bowl in 2016.
Toyota Motor was the only other marketer with a top five finish in both 2019 and 2018.
Top Five Spenders – 2019 Super Bowl
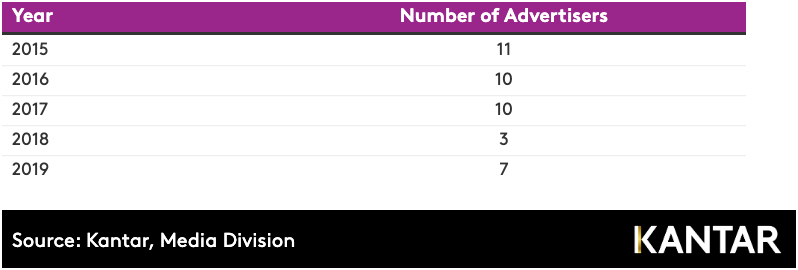
First-time advertisers
A typical year-to-year turnover rate among Super Bowl advertisers is around 40%. For example, there were 36 different marketers in the 2018 game and 13 of these did not advertise in 2019. The churn creates openings, and the replacement pipeline has historically delivered a steady flow of first-time participants who believe they can create and execute a successful strategy for their brands. After a dip in 2018, the number of Super Bowl rookies jumped to six in 2019 (ADT; Bumble; Expensify; Mint Mobile; Norwegian Cruise Line; and SimpliSafe). Newcomers who have already announced their participation in the 2020 games include Kellogg’s Pop-Tarts as well as Facebook.
# of First Time Advertisers in the Super Bowl
Auto remains the top Super Bowl advertising category
In recent years the Super Bowl has been a regular destination for multiple competitors in the auto, media and food categories.
Leading Ad Categories in The Super Bowl
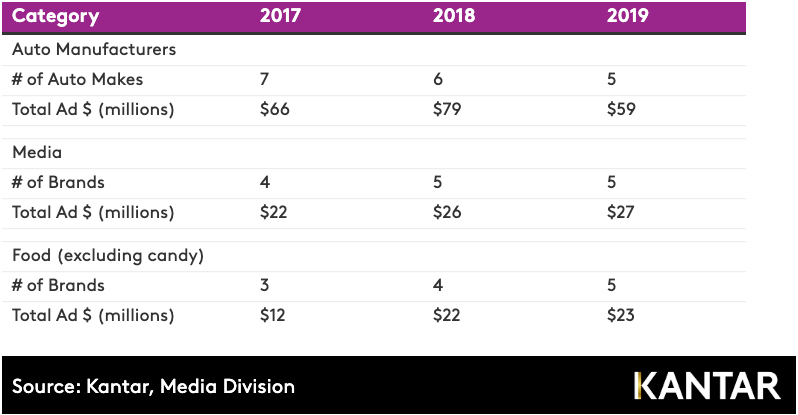
Auto manufacturers have had the largest footprint every year since 2011 but their presence has recently been contracting. Last year, five auto makers ran ads, accounting for 17% of all spending in the game – the category’s smallest share since 2010.
The media/entertainment category has become much more visible at the Super Bowl. Streaming video services have taken a page from the playbook of movie studios and are using the event to promote upcoming releases that can drive viewing and new subscriptions. Amazon Prime Video, Netflix, Hulu and CBS All Access aired messages in last year’s game.
Food manufacturers had a regular and significant presence in the Super Bowl during the 1980s and 1990s, before receding at the turn of the century when a focus on CPM efficiency took hold. The category rebounded in the 2010s with representation from a variety of brands. In the 2019 game the category contributed $23 million and a 6% share of total ad investments.
Super Bowl versus other sport franchises
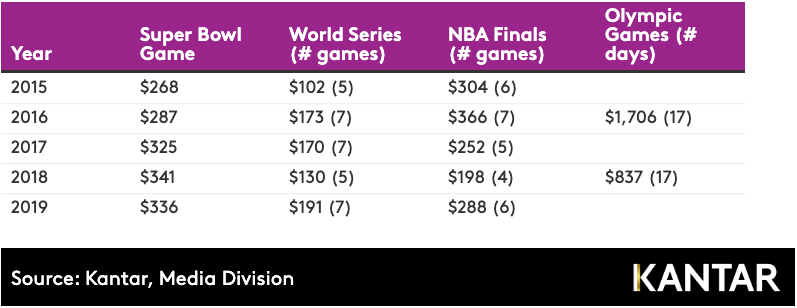
Despite the handicap of being a single-game event, the Super Bowl holds its own against the multi-game championship series of other professional sports leagues when it comes to TV ad expenditures. Only an NBA Finals that extends to six of seven games has been able to keep pace with the Super Bowl. The MLB World Series lags.
The combined total ad revenue of these three championship events surpassed $800 billion in 2019. While that’s an impressive amount, it’s dwarfed by the nearly $1.7 billion of TV ad money generated by the 2016 Summer Olympics and comparable to the $837 million earned by the 2018 Winter Games. Of course, the Olympics competition lasts more than two weeks and has hundreds of hours of linear TV coverage.
Major Sporting Events: National TV Ad Expenditures (in millions)
published on
31 January 2020
Category
More in Communications

How to build your brand in-game
A new research report from WPP and SuperAwesome

Mechanisms that Matter – Inside our partnership with Audible
How do you take a huge client like Audible from 22 agencies to one thriving networked team?

Healthcare communications – diverse, dynamic & different
Communicating about health and healthcare in APAC requires a nuanced and balanced approach